Author: Sylvie Kossodo, PhD | Associate Director, Scientific Development
Date: September 2020
Bioluminescence imaging (BLI) is a non-invasive optical imaging modality designed to visualize and quantify bioluminescent signal in tissues.1 BLI is based on the detection of visible light produced during enzyme-mediated oxidation of a substrate when the enzyme is expressed in vivo as a molecular reporter.
BLI offers a robust, sensitive and high throughput alternative relative to more traditional imaging and biodistribution studies using terminal endpoints, invasive procedures or radiolabeling. We were the first CRO to offer BLI in 2003 and in the 17 years since we have amassed considerable experience and know-how in this optical imaging field. In this Technology Spotlight we will present the principles of bioluminescence imaging and highlight advantages this preclinical service offers in cancer detection, monitoring disease progression and in vivo anti-tumor efficacy assessment.
BLI requires cells to express luciferase, a word suitably derived from the Latin lucifer—lightbringer, produced for example by fireflies or sea pansies. The firefly luc gene was first cloned in 19852 and since, green is the most used fluorescence color imaging. Firefly luciferase requires the injection of its substrate, D-luciferin which generates a bioluminescent signal peaking at 562 nm, captured by a high quantum efficiency charged coupled device camera (CCD) placed in a light-tight cabinet. The sequence of events leading from engineering tumor cells to express luciferase to imaging animals in vivo is illustrated in Figure 1. We use IVIS® In Vivo Imaging Systems (PerkinElmer, Waltham, MA) which allow high sensitivity and high resolution in vivo BLI and fluorescence imaging (FLI) across a wide range of wavelengths. Animals are imaged up to five at a time under 2% isoflurane gas anesthesia. Each mouse is injected with D-Luciferin and imaged 10-15 minutes after the injection. BLI signal is quantified in regions of interest (ROIs) drawn around tumors, specific areas (for example cranial, thoracic or abdominal), whole body or tissues ex vivo and the signal is expressed as photons per second, representing the flux radiating omni-directionally from the user-defined region. Images are analyzed using Living Image 4.3.1 (PerkinElmer, Waltham, MA) software.
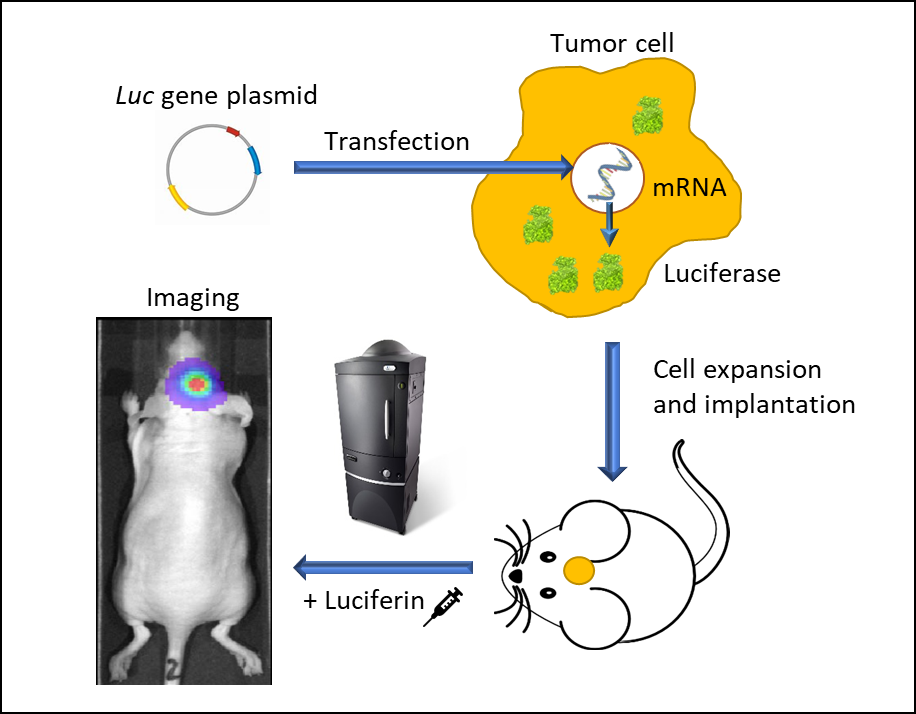
Figure 1: In vivo bioluminescence imaging using luminescent living cells. A vector carrying a promoter-driven luc gene is transfected into a tumor cell. Stably transfected cells are expanded and implanted into a mouse. Following tumor growth, the animal is injected with luciferin and imaged in an IVIS imaging system under anesthesia. Luc-cells emit light and can be traced spatiotemporally.
Monitoring Orthotopic Solid Tumor Growth
Over the past 20 years, the effectiveness and sensitivity of BLI methods and tools have resulted in an ever-broadening catalogue of applications: studies of protein-protein interactions, genetic screening, cell-cycle regulators, parasitic infections, stem cell engraftment tracking, NK cell migration and above all, preclinical oncology. A significant number of studies have shown the ability of BLI imaging to temporally assess tumor development.3 This is particularly critical when tumor growth cannot be determined by caliper measurements and relies either on clinical signs such as weight loss or tumor burden assessment after euthanasia of the animals. In the examples shown below animal care and use was conducted according to animal welfare regulations in an AAALAC-accredited facility with IACUC protocol review and approval.
Examples highlighting the value of non-invasive BLI in monitoring deep-tissue tumor development are shown in Figure 2. NCI-H460-Luc2 human lung carcinoma xenografts were implanted orthotopically (OT) (1x10⁵ cells/mouse) in the left lung of female nude mice. BLI (Figure 2, top left) show tumors in the thoracic cavity detectable as early as 8 days post tumor cell implantation (not visible in the image due to thresholding to the maximum signal seen on day 28), and tumor burden increasing over the next 2 weeks. Mice experienced a mean percent body weight loss of 18.3% throughout the duration of the study, likely to be disease related (not shown) and were euthanized 28 days after tumor cell implantation. Necropsy revealed significant growth of the primary tumor and substantial development of masses throughout the thoracic cavity. In Figure 2, bottom left, female albino C57BL/6 mice were implanted intracranially with GL261-luc2 syngeneic murine glioma cells (1x10⁶ cells/mouse). Tumors were detectable in the brains 7 days after implantation. Weight loss associated with disease progression is common in this model and was detectable 11 days after tumor implantation while the median time of death was approximately 21 days. The human breast adenocarcinoma cell line MDA-MB-231-luc-D3H2LN forms bone lesions after intracardiac injection (1x10⁵ cells/mouse) in female nude mice. Bone lesions were clearly visible 21 days after tumor cell injection and both the number of tumors and the total tumor burden increased over the next 3 weeks (Figure 2, right side, top and bottom). Mice experienced a maximum weight loss of 16.2% by Day 32. Body weight loss was largely related to the aggressiveness of the model (not shown). The takeaway message from these studies is that BLI can be a powerful tool for investigating a variety of tumor types in real-time and non-invasively without relying solely on clinical signs of disease which may, or may not, accompany increasing tumor burden.
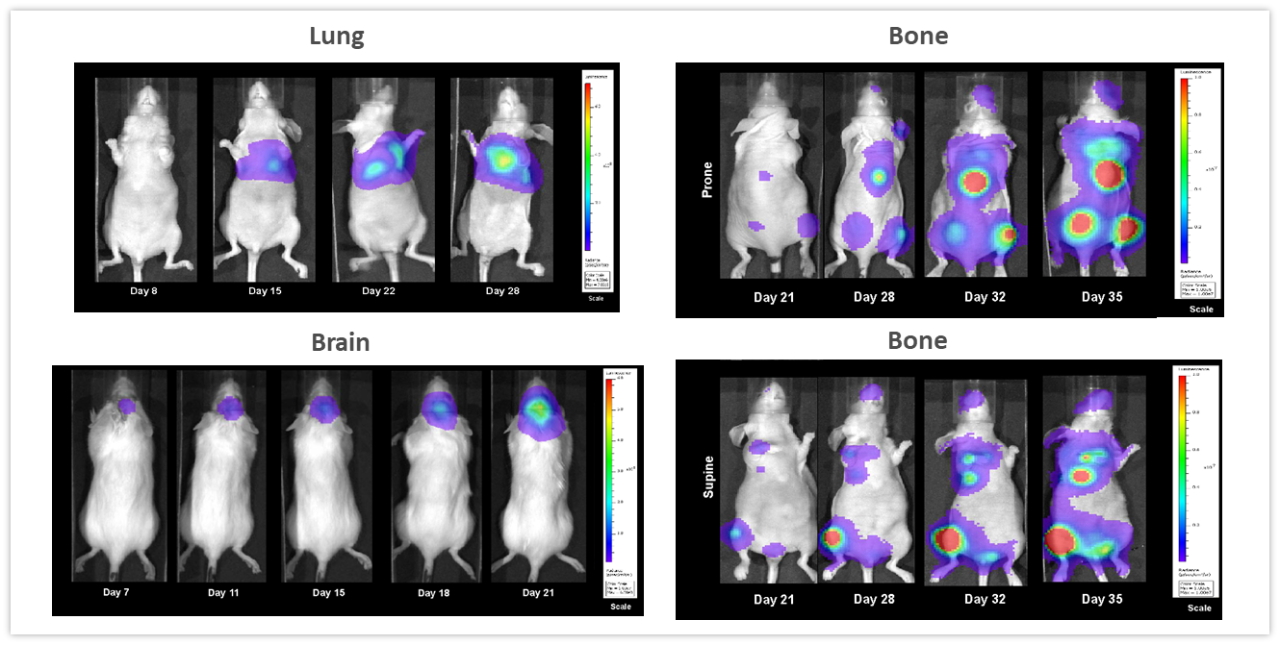
Figure 2: Representative BLI images across several in vivo models. Top left, NCI-H460-Luc2 human lung carcinoma implanted OT (left lung) in female nude mice. Lower left, syngeneic murine glioma GL261-luc2 cells implanted OT (brain) in female albino C57BL/6 mice and right side, human mammary tumor MDA-MB-231-luc-D3H2LN bone lesions after intracardiac injection in female nude mice showing whole body images in the prone (top) and supine (lower) positions.
Imaging Hematologic Malignancies
With over 80 unique hematological malignancy cell lines, we lead the industry with market-relevant hematologic malignancy models, particularly pertinent in the adoptive cell therapy (ACT), also known as cellular immunotherapy, field.4 BLI is critically valuable when evaluating progression and treatment response in hematological disseminated malignancies. Longitudinal studies performed in 4 different human hematological cancer cells injected IV into NSG mice showed increased tumor burden over time in all models (Figure 3) underscoring BLI’s value in repeated assessment of disease progression and severity, as well as understanding the biodistribution of tumor signal throughout the body.
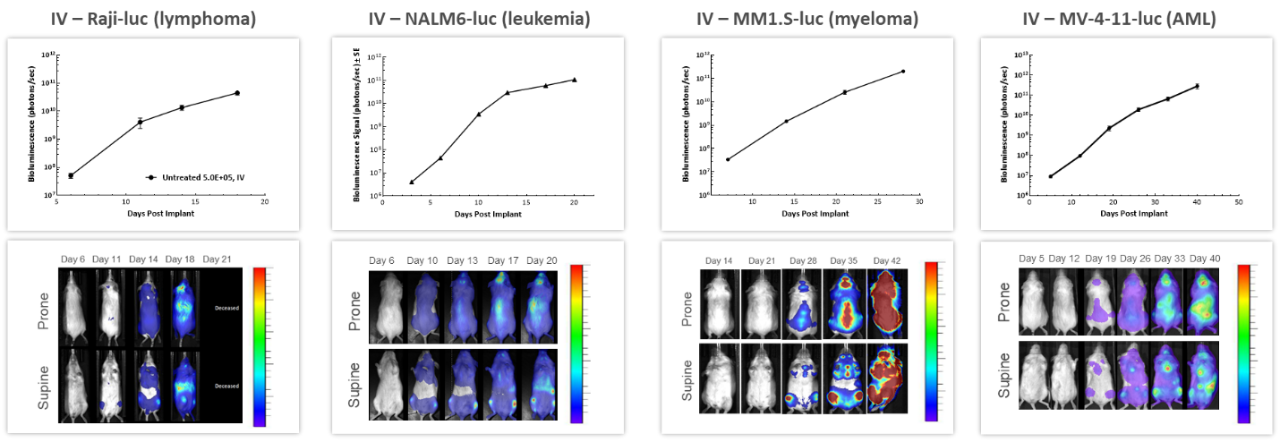
Figure 3: Representative BLI data across several in vivo human hematologic malignancies following IV injection in NSG mice.
ACT are continuously evolving, providing better and more personalized options for patients. CAR-T cells are autologous or allogeneic T cells specifically targeting antigens or markers expressed by tumor cells. Preclinical in vivo assessment of the efficacy and safety of CAR-T cells is crucial before translating these new therapies into the clinic. The study shown in Figure 4 was designed to test different CAR-T preparations and doses in human Raji-luc B cell lymphoma cells implanted IV in NSG mice. The 3 different CAR-T constructs significantly inhibited tumor burden and prolonged survival, highlighting the value BLI brings to the development of these new cellular immunotherapies.
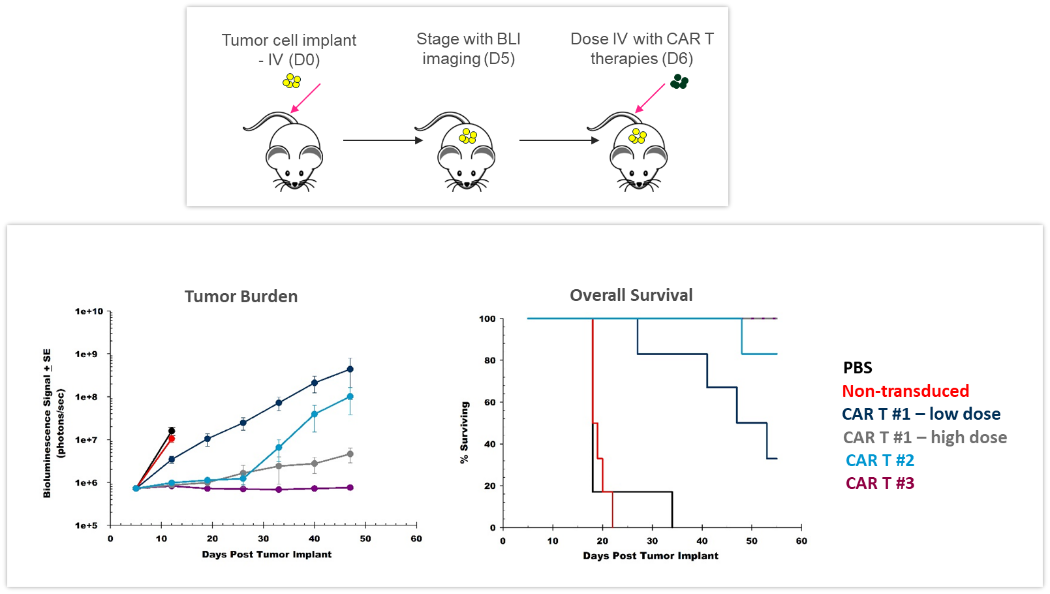
Figure 4: Effect of CAR-T therapy against human Raji-luc B cell lymphoma implanted IV into NSG mice. Top: Schematic diagram of tumor cell inoculation and CAR-T therapy. Bottom: Tumor burden assessed by BLI and overall survival.
Monitoring Treatment Efficacy
Radiation
Clearly, one of the key advantages of BLI is the ability to track the efficacy of anti-tumor therapies over time in the same animal, leading to a reduction in the number of animal used. In the example shown in Figure 5, female nude mice were implanted intracranially with NCI-H1975-luc human non-small cell lung carcinoma in order to mimic lung metastasis to the brain. Mice received two courses of fractionated radiation (2Gy; 5 days on, two days off for two cycles), delivered by a RadSource RS-2000 irradiator. The control group was sham irradiated. BLI images were acquired over time and demonstrated that radiation significantly reduced tumor burden (Figure 5, p<0.05 on day 19) and increased life span by 160% (p<0.05, not shown). In this experiment, we were able to quantify treatment response in vivo, critical when monitoring efficacy as well as designing and refining new therapeutic approaches.
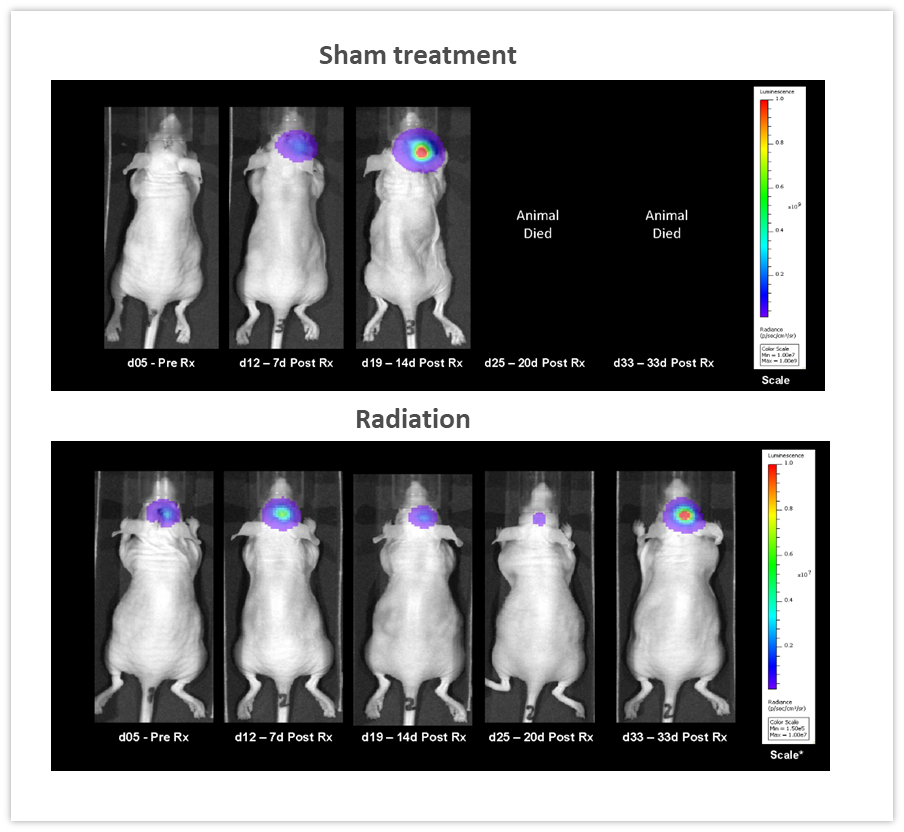
Figure 5: Effect of localized radiation treatment (2Gy; 5 days on, two days off for two cycles) against intracranially implanted NCI-H1975-luc human non-small cell lung carcinoma in female nude mice.
Checkpoint Inhibition and Combination Therapy
The effect of checkpoint inhibition, alone or in combination with radiation, was tested in murine syngeneic GL261-luc2 glioma cells implanted intracranially in female albino C57BL/6 mice. Mice were left untreated, treated with radiation, delivered by the Small Animal Radiation Research Platform (SARRP; Xstrahl Inc.), at a single 7.5Gy dose, anti-mouse PD-1 (clone RMP1-14, 10 mg/kg) or the combination of both therapies. As shown in Figure 6 (left), BLI signal was already detectable 6 days post-tumor cell implantation and progressed over the next several weeks. Quantification of the resulting bioluminescent signal (right) showed the effect of treatments on tumor burden. Anti-mPD-1 treatment led to 2.6 days tumor growth delay and 1/8 tumor free survivor (TFS) while radiation resulted in 16.6 days tumor growth delay and 2/8 TFS. The combination of radiation and anti-mPD-1 treatment resulted in significant 38.6 days of tumor growth delay and complete remission with 7/8 mice. Traditional methods of gauging anti-tumor response in malignancies located deep within the body are based on terminal and often, time consuming read-outs. As shown in these examples, the integration of in vivo BLI imaging has allowed us to shift from a “black box” of tumor therapy to real-time assessment of individual responses, providing the flexibility to adjust and refine treatments more rapidly.
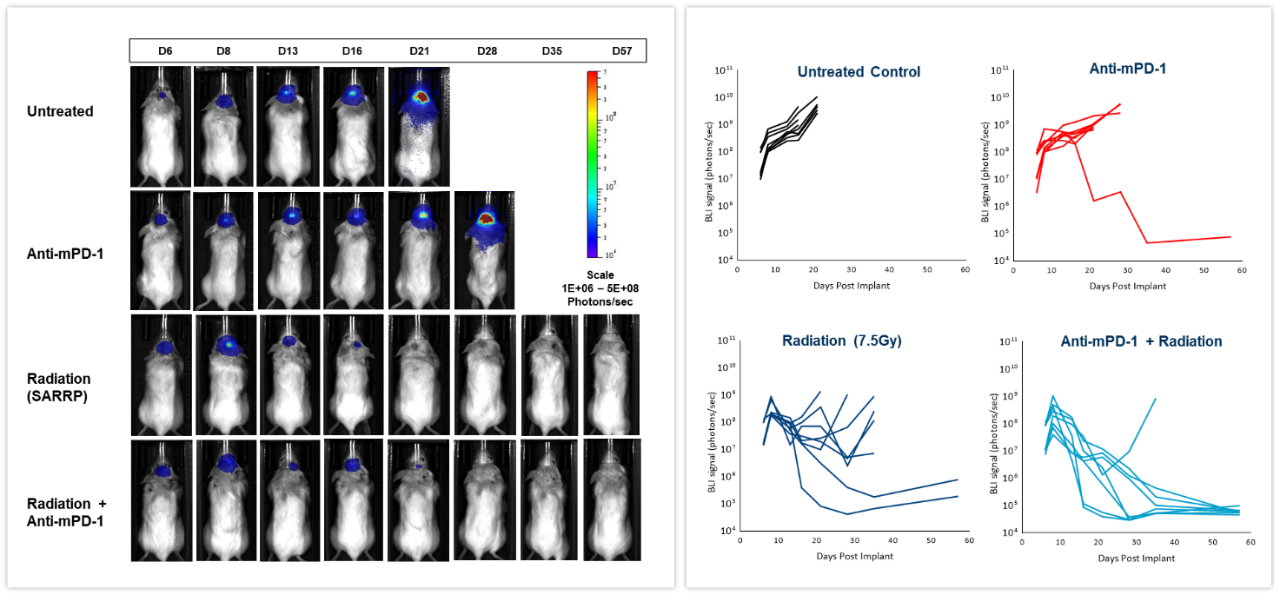
Figure 6: Effect of focal radiation, anti-mPD-1 and combination therapy in intracranial GL261-luc tumors in female C57BL/6 albino mice.
Multimodality
BLI can be coupled with other imaging modalities to interrogate different biological pathways. To illustrate this application, we used syngeneic 4T1-luc2-1A4 mouse breast adenocarcinoma cells injected OT into the mammary fat pad of immunologically competent BALB/c mice. When tumors reached ~300 mm3, a near-infrared imaging agent, ProSenseTM750 was injected IV to detect cathepsin activity associated with aggressive breast cancer growth. ProSenseTM750 is an optically silent agent which becomes fluorescent upon cleavage with cathepsins. As shown in Figure 7, BLI and FLI tumor signals were readily detectable in tumors. However, BLI and FLI signals were not perfectly superimposable which is expected given that luciferase is produced by all living tumor cells while the fluorescent signal is confined not only to tumor cells but also other tumor-associated cells, mainly macrophages, responsible for the cleavage and uptake of the cathepsin ProSenseTM750 probe. Multimodality can thus be used to interrogate different biologies in vivo, simultaneously.
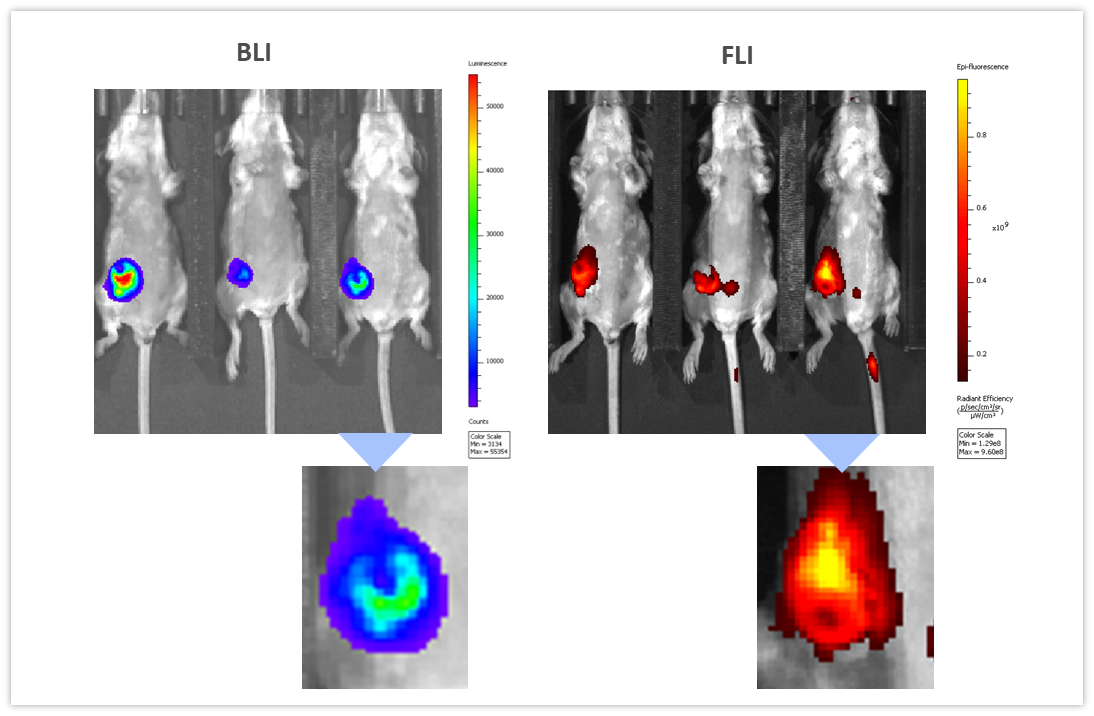
Figure 7: Multimodality imaging of 4T1-luc2-1A4 tumors by BLI (left) and FLI (right) 24h after IV injection of the cathepsin-specific ProSenseTM750 fluorescence probe. Below are closeups of the corresponding tumors.
Summary
Mouse models of deep-tissue cancer and cancer metastasis rely predominantly on terminal assessments like tissue weight, nodule counts, and/or histologic analysis for the assessment of tumor burden. Since its introduction well over 20 years ago, BLI has become an invaluable technique to track the growth dynamics of bioluminescently-tagged cancer cell lines over time and in response to various therapeutic approaches in vivo, minimizing the number of animals on study since the same subjects can be imaged over time without the need for terminal assessments. BLI has generated significant contributions to a variety of scientific fields, in addition to providing an alternative to the use of established invasive or radioisotope-dependent non-invasive imaging modalities.
Contact the scientists to request the full data set or to learn more about our BLI service and how it can be applied to your preclinical research.
References
1Contag CH, Spilman SD, Contag PR, Oshiro M, Eames B, Dennery P, Stevenson DK, Benaron DA. Visualizing gene expression in living mammals using a bioluminescent reporter. Photochem Photobiol 1997; 66: 523–531.
2de Wet JR, Wood KV, Helinski DR, DeLuca M. Cloning of firefly luciferase cDNA and the expression of active luciferase in Escherichia coli. Proc. Natl. Acad. Sci. U.S.A. 1985; 82, 7870–7873.
3 Jenkins DE, Oei Y, Hornig YS, Yu SF, Dusich J, Purchio T, Contag PR. Bioluminescent imaging (BLI) to improve and refine traditional murine models of tumor growth and metastasis. Clin Exp Metastasis, 2003; 20(8):733-744.
4 https://www.cancerresearch.org/immunotherapy/treatment-types/adoptive-cell-therapy
Note: Please note that all animal care and use was conducted according to animal welfare regulations in an AAALAC-accredited facility with IACUC protocol review and approval.
Connect
Let's start a conversation
Contact Us
Labcorp is a leading global life sciences company that includes contract research and developmental services to the pharmaceutical, medical technology, crop protection and chemical industries.