Image Analysis

Contact Us

We do not deliver just images and numbers—we also offer scientific solutions using imaging to address a customer’s business needs. We feel the development of an image analysis protocol is thus equally important as development of an imaging method; as it dictates the data deliverables for customers. With smart design, an image analysis protocol allows us to fully exploit the capability of the imaging system and in turn, our customers receive more meaningful information from their study to help them make informed decisions. To that end, we have invested in the development of the following in-house tools to increase automation of image analysis.

Our Tumor Image Analysis Applications include:

BLIZZARD™ for BLI Analysis

Fully Automatic, High-throughput Signal Analyzer with Multiple Disease Model Support

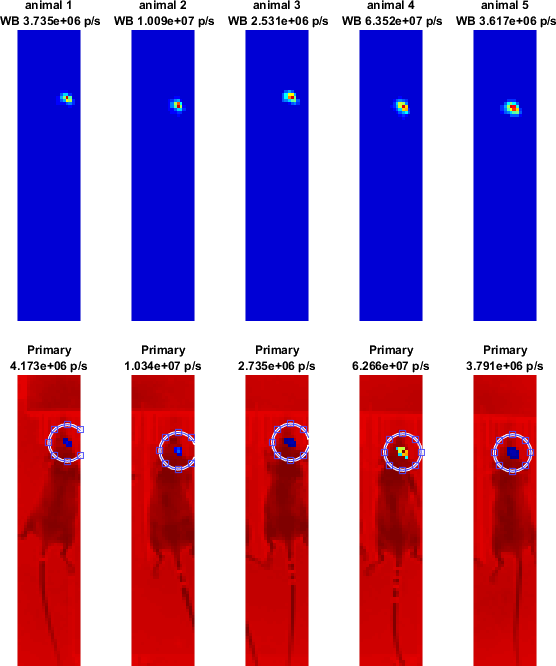
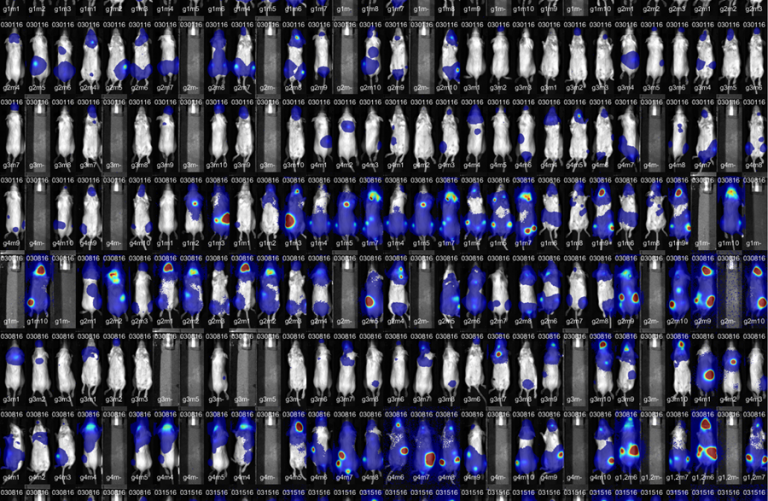
Automation of image analysis does not just boost our throughput; it substantially increases the accuracy of analysis since human bias is eliminated. Both are showcased in our fully automated BLI data analysis using our BLIZZARDTM tool. Users only need to specify a folder containing raw data to be analyzed, and BLIZZARDTM automatically identifies and analyzes it, performs whole-body signal and/or localized signal based on the tumor model, then writes results with subject information into an Excel data sheet. Analysis of hundreds of subjects only takes a few minutes. No manual creation of region of interest (ROI) over signal is needed, greatly reducing analysis time. The human side of BLIZZARDTM offers a result inspection view for quality assurance, and a representative image feature enabling a user to quickly export results across different time-points in a study on a global scale for review and comparison purposes. Since its release, BLIZZARDTM has made our already successful BLI imaging service even more compelling.

Fully Automated BLI Flux Analysis of Whole-body and Primary Tumor Using Blizzard™

Fully Automated BLI Flux Analysis of Whole-body and Primary Tumor Using Blizzard™
  Representative Image Exporting View in BLIZZARD™

Representative Image Exporting View in BLIZZARD™

REDCAT™ for DCE MRI Analysis

Fully Automatic Tofts Model solver with Pre-contrast T1 Map Support

A fully quantitative dynamically contrast enhanced (DCE) MRI analysis procedure requires fitting a pre-contrast T1 map, converting signal intensity into actual tissue concentration of contrast agent, and finally, solving a pharmacokinetic model. It generates a series of results including T1, contrast concentration, initial area under curve (iAUC), volume transfer constant (Ktrans), fractional extracellular extravascular space volume (Ve) and fractional plasma volume (Vp). These procedures and outputs have been long established in clinical studies. Our in-house developed REDCATTM tool is capable of performing such an analysis with just a few mouse clicks, and offers the results in both ROI-based numerical values and pixel-based parametric maps. REDCATTM does not just simplify our analysis; it extracts more accurate and clinically-relevant information from a classical MRI method used extensively in oncology imaging.

 Tumor Permeability Analysis using REDCAT™ for DCE MRI Analysis

 Tumor Permeability Analysis using REDCAT™ for DCE MRI Analysis

OASIS™ for CEST MRI Analysis

Fully Automatic Z-spectrum Analyzer Covering CEST-based pH Measurement and Asymmetrical Magnetization Transfer Ratio

Another handy tool we’ve developed, called OASISTM, increases efficiency of our imaging development process and enables us to focus on imaging sequence design and agent application. For example, when we apply our new tissue pH measurement method using Chemical Exchange Saturation Transfer (CEST) MRI, our OASISTM tool runs in parallel with the scanner, so that the effect of a parameter change can be evaluated in real-time. In vivo measurement of tissue pH using CEST MRI is very sensitive to tissue uptake of contrast agent and response to radio frequency pulses. OASISTM does not just report pH values; it also visualizes more perspectives of the data collected, thus offering us more insights into the complex interrelation among imaging sequence, contrast agent, and tissue physiology. Use of this tool is instrumental in our effort to maximize the capability of a novel imaging approach.

 Tumor pH Measurement using OASIS™ for CEST MRI Analysis

 Tumor pH Measurement using OASIS™ for CEST MRI Analysis

SIFT™ for MRS Analysis

Fast and Intuitive NMR Spectrum Quantification

Interactive Measurement of Brain Metabolites Using SIFT™ for MRS Analysis

Interactive Measurement of Brain Metabolites Using SIFT™ for MRS Analysis

Let's start a conversation

Contact Us